INTEGRATED GIS FOR CRIME ANALYSIS
DESCRIPTION
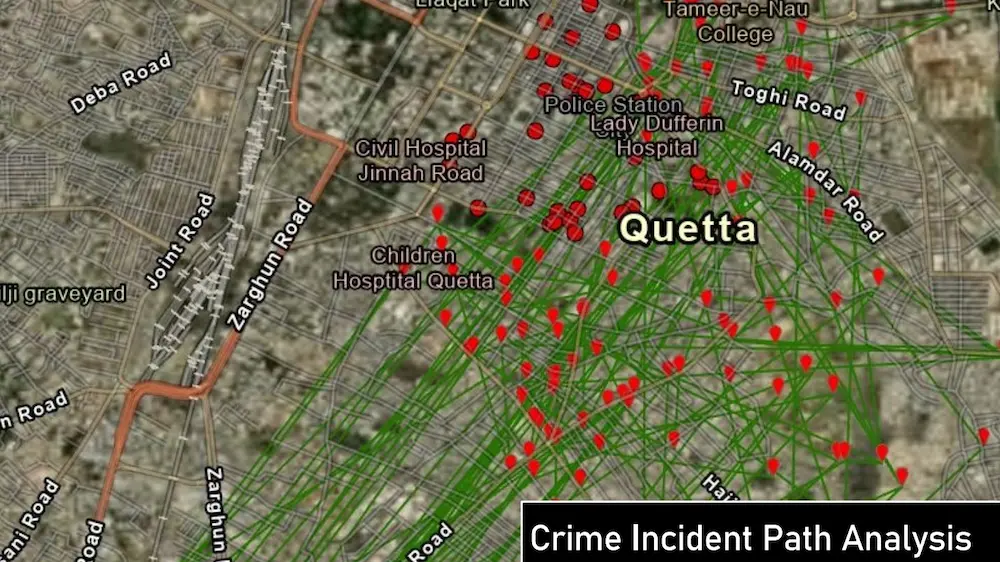
Integrated Geographic Information Systems (GIS) for visualizing and analyzing crime data geographically, GIS helps in identifying patterns, trends, and hotspots, improving strategic decision-making and resource allocation.

Spatial Mapping
Visualizes crime incidents on detailed maps, highlighting patterns and trends across different geographic areas.
Data Integration
Combines crime data with other spatial information for comprehensive analysis.
Hotspot Analysis
Identifies high-crime areas through heat maps and spatial clustering techniques.
Predictive Analytics
Uses historical data and statistical models to forecast potential crime hotspots.
Incident Tracking
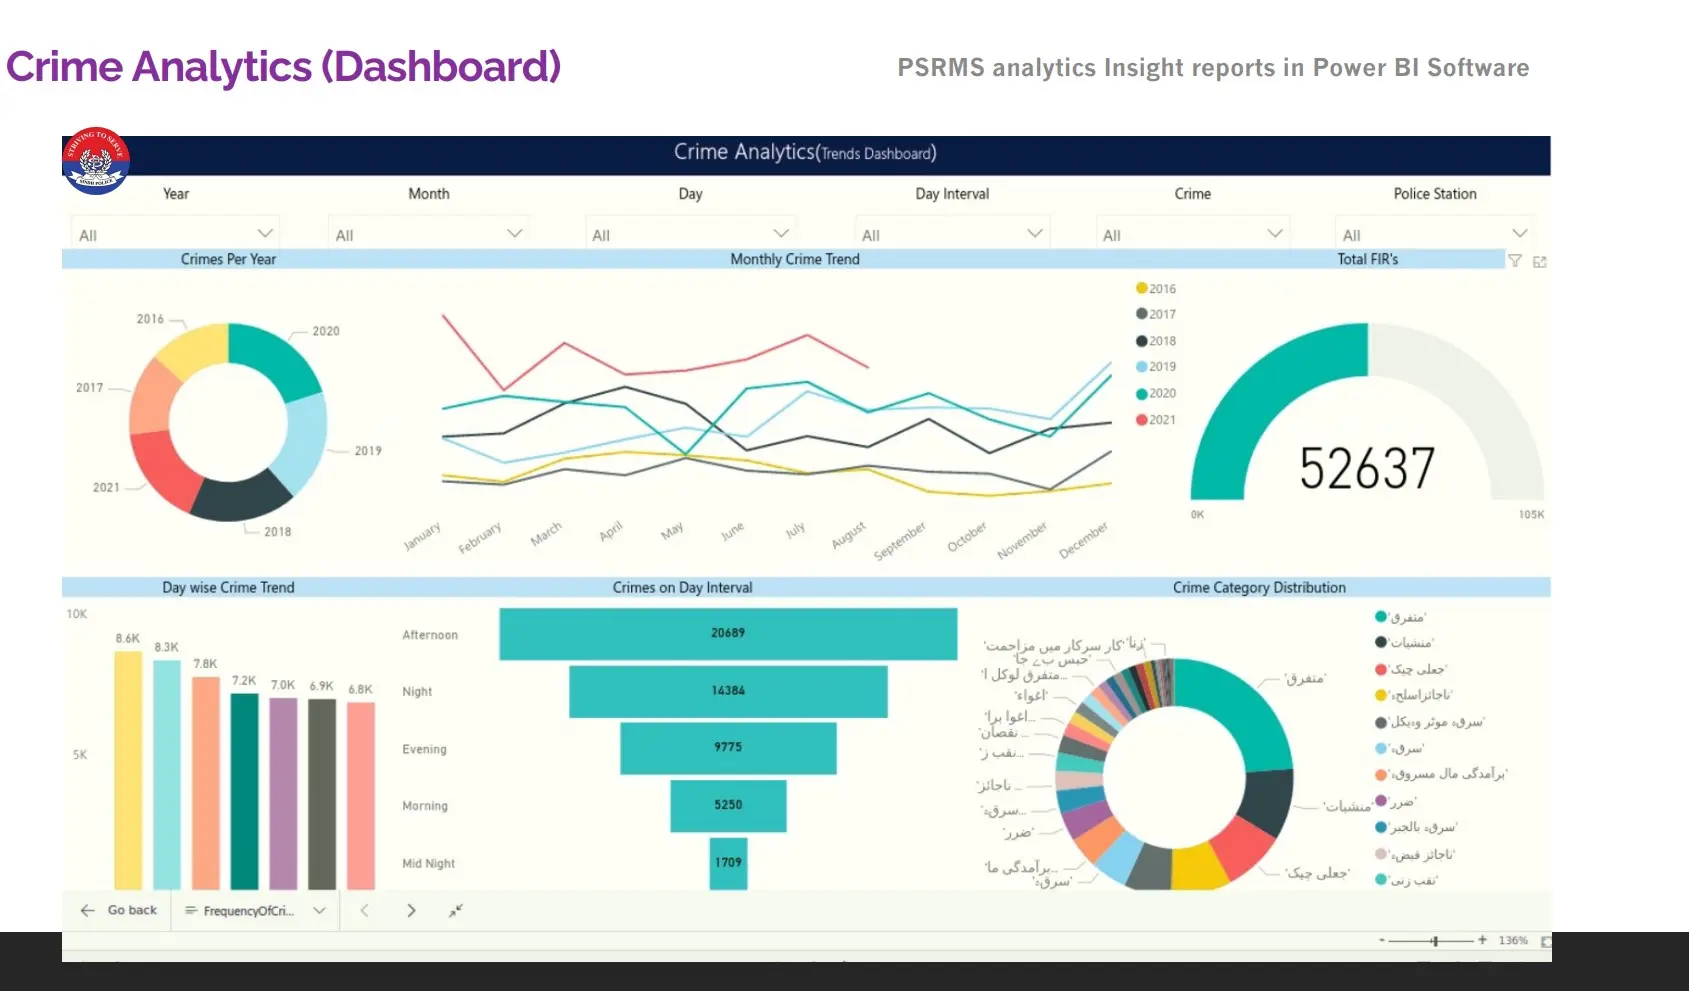
Tracks and analyzes the location and frequency of criminal activities over time.
Resource Allocation
Assists in optimizing the deployment of law enforcement resources.
Public Engagement
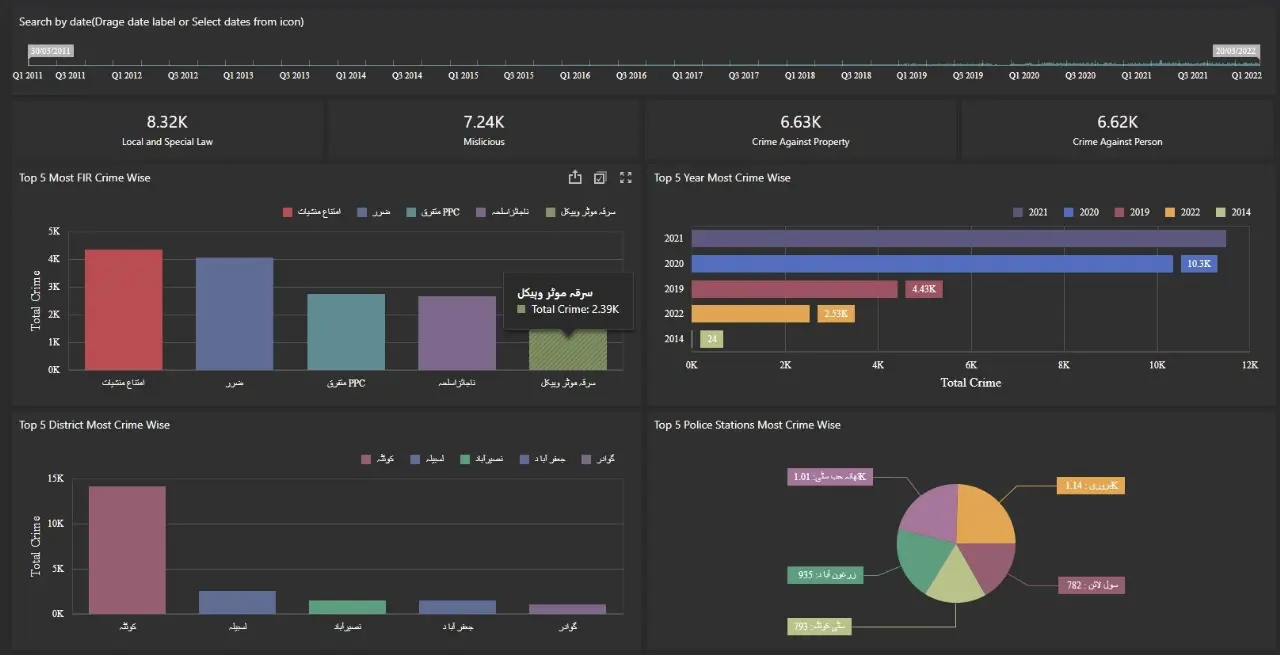
Provides interactive maps and crime data visualization for public awareness.
Reporting and Visualization
Generates detailed reports and visualizations for law enforcement analysis.


